When Mending Changes the Equation

Today we explore measuring the environmental impact of community repair in the UK, focusing on waste diverted from disposal and the carbon saved when items are fixed rather than replaced. Expect plain-language guidance, practical methods, and real stories from lively repair events, where neighbours, volunteers, and tinkerers turn broken objects into durable companions. You’ll learn how numbers support funding bids, influence local policy, and inspire participation—all without losing the human warmth that makes repair gatherings special.

Counting What Repair Achieves in Everyday Life

Across UK high streets, libraries, and halls, community repair brings together patience, practical skill, and a shared wish to waste less. Measuring outcomes strengthens that spirit. By translating repaired toasters, laptops, and coats into avoided bin weight and estimated carbon savings, groups can evidence real-world benefits. Clear metrics help volunteers celebrate progress, councils recognise value, and residents see how a single fix contributes to cleaner streets, lighter bins, and a climate-friendly local economy rooted in care and resourcefulness.

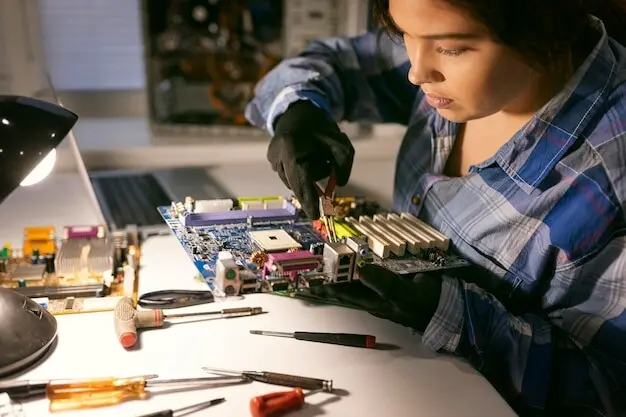
Field Data without the Fuss

Capturing reliable data at bustling repair events depends on smooth flow, clear responsibilities, and gentle prompts. A welcome desk can assign numbers, a triage volunteer notes item details, and a finisher records outcomes once the owner smiles. Keep pens, clipboards, and backup batteries ready. Align the process with volunteer energy, not the other way around. After closing time, a short debrief helps correct typos, share learning, and appreciate the cheerful chaos that powered another measurable, meaningful community day.

Turning Waste Diversion into Meaning

Waste diversion shines a light on mass kept away from bins, refuse trucks, and incinerators. In repair settings, it represents the weight of items that continue serving rather than entering disposal streams. To interpret this responsibly, define clear rules: count successful fixes that avoid immediate replacement, handle partial repairs thoughtfully, and exclude items merely postponed for specialist attention. When explained with local context—such as council contamination targets—these kilograms become stories residents understand, funders believe, and policymakers can confidently support.

Estimating Carbon the Right Way

Carbon savings represent the avoided emissions from manufacturing, transporting, and disposing of a new product, minus the minimal impacts associated with repair activities. In the UK, applying recognised product-level factors and transparent assumptions is crucial. Prioritise sources aligned with UK conditions, treat textiles and electronics with category-specific care, and express uncertainty ranges where evidence is thin. By foregrounding methods, your headline number becomes a conversation starter with councils, libraries, and funders seeking robust yet practical evidence of climate-positive community action.

01

Choosing Factors That Fit UK Reality

Select carbon factors from trusted, UK-relevant sources, such as government conversion factor guidance, WRAP studies, or peer-reviewed research. Map your categories to the closest available product class—like small appliances or laptops—and note any substitutions. Avoid mixing regional datasets without explanation. Document the year of factors, as updates shift results. Where a product lacks a direct factor, apply a conservative analogue and explain why. This disciplined alignment turns volunteer-entered data into numbers that funders and policymakers can confidently endorse.

02

Lifetime Extension and Rebound Considerations

Carbon savings hinge on extra years of service. Record a realistic extension, then test sensitivity with shorter and longer scenarios. Acknowledge rebound risks, like improved performance leading to higher energy use, especially with older appliances. Where energy efficiency matters, pair repair with guidance on mindful use and simple maintenance. Include a small line item for repair activities—travel, parts—to avoid overstating benefits. Framed this way, your estimate becomes balanced and useful for comparing interventions, grant applications, and local climate action plans.

03

Expressing Uncertainty with Grace

Communicate ranges, not just single numbers. Provide a central estimate with low and high bounds, and a short note about key drivers—weight, lifetime, and factor choice. Use approachable visuals, like shaded bars, to convey variability without fear. For community events, a simple legend explaining why ranges exist invites questions and learning. Decision-makers value humility backed by method. Over time, as your dataset grows, you can narrow ranges, update assumptions, and celebrate improved precision alongside the familiar joy of a well-timed fix.

Stories, Visuals, and Partnerships

Numbers resonate when paired with the people who made them real. A graph earns its power from the grandmother teaching a volunteer to darn neatly, or the teenager reviving a laptop for schoolwork. Share monthly diversion totals, carbon ranges, and a short vignette from each session. Co-create posters with libraries, councils, and repair networks to reach neighbours who have never attended. Visuals should invite curiosity, not overwhelm. When stories lead, the metrics become memorable, persuasive, and beautifully local.

Grow the Movement through Shared Measurement

Measurement thrives when everyone understands the why, not just the how. Build a culture of gentle accuracy, where new volunteers feel safe asking questions and regulars agree on simple protocols. Publish your approach so neighbouring groups can adopt and adapt. Host seasonal data meetups to compare methods, celebrate milestones, and swap reference sheets. Invite readers to subscribe, share experiences, and bring a friend to the next event. Collective practice turns scattered efforts into a confident, evidence-led repair landscape across the UK.
Welcome newcomers with a five-minute tour of the journey from hello to impact: intake, triage, fix, finish, record. Show a laminated example form and explain how each field supports waste and carbon figures used in reports, posters, and grant bids. Pair them with a friendly buddy for the first session. Rotate roles so everyone experiences both the human connection and the quiet satisfaction of tidy numbers. Purposeful onboarding anchors retention, confidence, and credible reporting that steadily improves.
Close each event with a two-minute circle: one surprising fix, one thing to improve in data capture, and one heartfelt thank-you. Email a short digest with totals, a photo, and next steps. When a metric improves—fewer missing weights, clearer categories—celebrate it alongside the best repair story. Small, regular acknowledgements compound, building reliability without bureaucracy. Over months, these loops reduce guesswork, strengthen relationships, and turn fragile spreadsheets into a living record of care, skill, and environmental benefit.
If this guide sparked ideas, bring an item to your nearest repair session, volunteer for greeting or data entry, or help refine carbon assumptions with relevant expertise. Subscribe for monthly summaries that combine warm stories with credible numbers. Share our printable weight references with local groups. Tell us which metrics helped secure support in your town. Every reply we receive becomes part of a stronger, smarter, kinder network where practical action against waste and emissions is measured, celebrated, and joyfully scaled.
Palotemidaxinexolento
Privacy Overview

This website uses cookies so that we can provide you with the best user experience possible. Cookie information is stored in your browser and performs functions such as recognising you when you return to our website and helping our team to understand which sections of the website you find most interesting and useful.